
Having more access to how your content and account are performing on TikTok thanks to analytics can help you understand the platform better. In this article, you’ll find out a step-by-step guide on how to check your TikTok analytics and use them to calculate your viewer-to-follower conversion rate.
All About TikTok Analytics
Understanding the TikTok analytics isn’t rocket science. You just have to learn it as you go! Keep reading to find out how you can make your performance better by keeping track of it.
1. Switch to TikTok Pro Account to View Your Analytics
Before you do anything else on TikTok, switch your account to a Pro Account. This is what allows you to gain access to your analytics. You’ll want to do this as soon as possible so TikTok can start tracking your overall audience and published content.
Switching to a Pro Account is an easy and simple process. Start by going into your account’s settings. Then click on Manage My Account. On the next page, all the way to the bottom tap on Switch to Pro Account. Once you’ve done that, you’ll be prompted to select a category. Choose the one which is most relevant to your account, but don’t worry this won’t be displayed publicly on your profile.
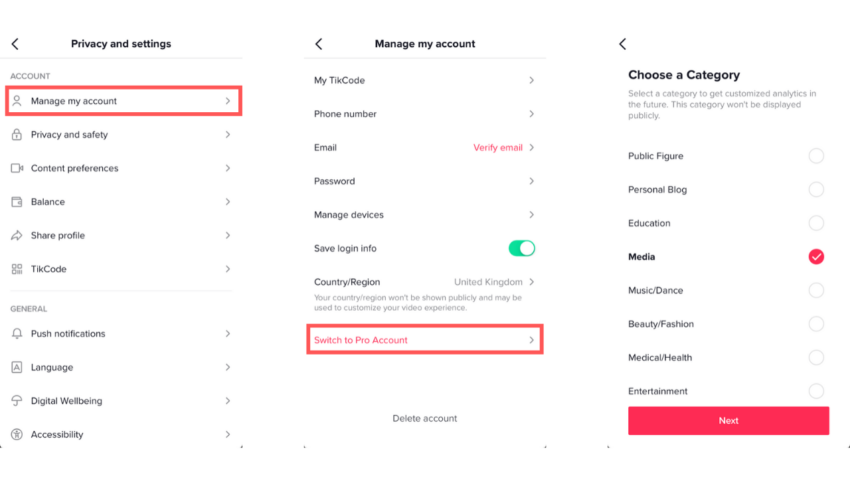
Once you’ve done this, the last step will be to verify your email.
If you can’t do this on a desktop, you can also use a mobile phone number and receive a text instead.
Once you’ve done all of this your Pro Account should be all set up. Now if you navigate back to your Settings menu you should see the Analytics tab.
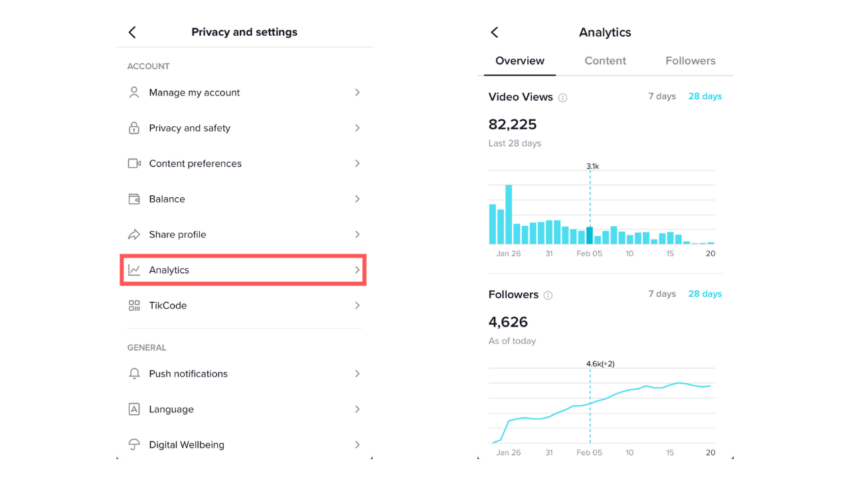
Although you now have access to your TikTok analytics, you won’t actually see any data there yet. This is because you’ve only just set up your account. You need to wait 7 days until TikTok starts to display your account’s analytics.
After these 7 days, your account will start showing data about your account and its content. When it comes to what you actually get in these analytics, there are three main categories.
- Account Overview Analytics
- Content Insights
- Follower Insights
You can tap on each one of these tabs and get a deeper look into each one.
2. TikTok Account Overview Analytics
Under the overview tab, you get access to three key parts of data. Video views, Followers, and Profile Views. These are helpful to get an understanding of how your content is performing.
Video Views
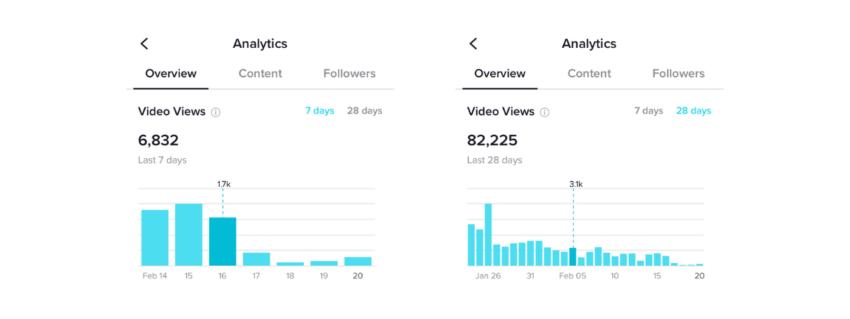
At the top of the overview tab is where the video views are displayed. Here you can see how many views you got in total or on individual days in the past 7 or 28 days.
Followers
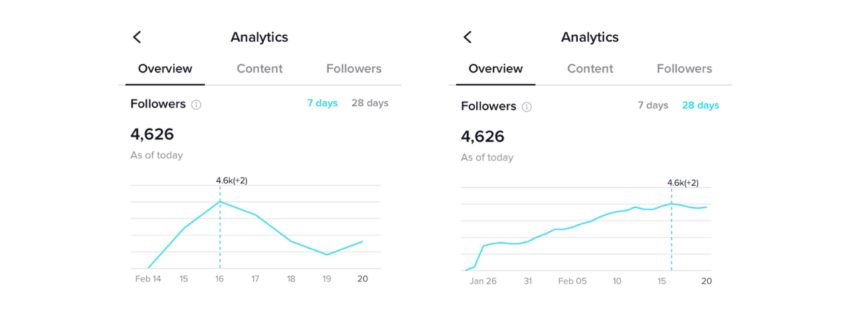
Just below the video views, you can see your total amount of followers over the past 7 or 28 days.
This graph is useful due to the fact that you can pinpoint a growth surge in a specific video post just by aligning the dates. It helps you to see what content has performed well and converted viewers into followers.
Profile Views
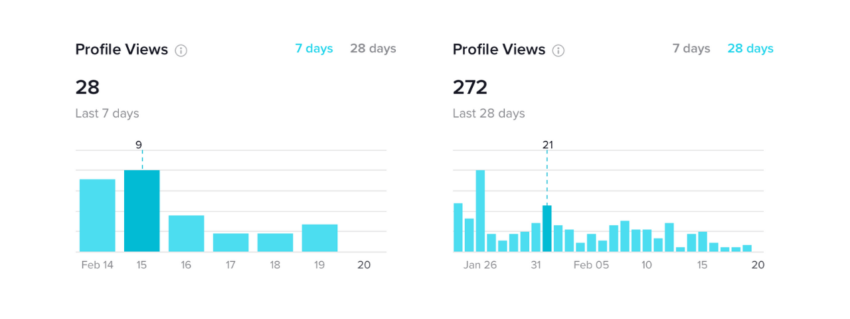
In the last section under the profile overview tab, profile views allow you to see the amount of TikTok users that have visited your profile in the past 7 or 28 days again because this is broken down by day. You can see what content is driving people to view your profile.
Conversion Rates
Although this data is pretty basic, it can still be very useful to understand how your account is performing. For example, you can also calculate your video watcher to follower conversion rate and I’m going to show you exactly how to use my numbers.
We did an experiment too. We got 82,225 views on your videos, which led to 272 profile visits for the month.
If you want to know the percentage of video viewers that converted into profile visitors over the last 30 days, you can calculate this percentage by using the following formula.
So the percentage of our video viewers that ended up viewing our profile was only 0.3308%. In our opinion, that is a very small amount.
Now if we wanted to calculate the percentage of the people who viewed our profile that actually followed us, we would use the same formula but this time replace the video views with the profile visits and then replace the profile visits with the number of followers we got in the past 30 days.
To find out how many followers we gained over the past 30 days, we manually added up the total of each day, because unfortunately, TikTok shows you your total following and not the amount you’ve gained that month. We counted 51 followers.
So this is the calculation to find the percentage of our profile visitors that turned into actual TikTok followers.
That means that 18.75% of the people who viewed our profile ended up following us!
But this won’t be entirely correct due to the fact that people can follow you directly from the For You page, meaning that someone could have followed us without even seeing our profile.
3. TikTok Content Analytics
Now we’ve gone through TikTok’s Overview analytics, we’ll now be taking a look at the next tab which is the Content tab. Here you can see detailed insights about the content you post.
Video Posts
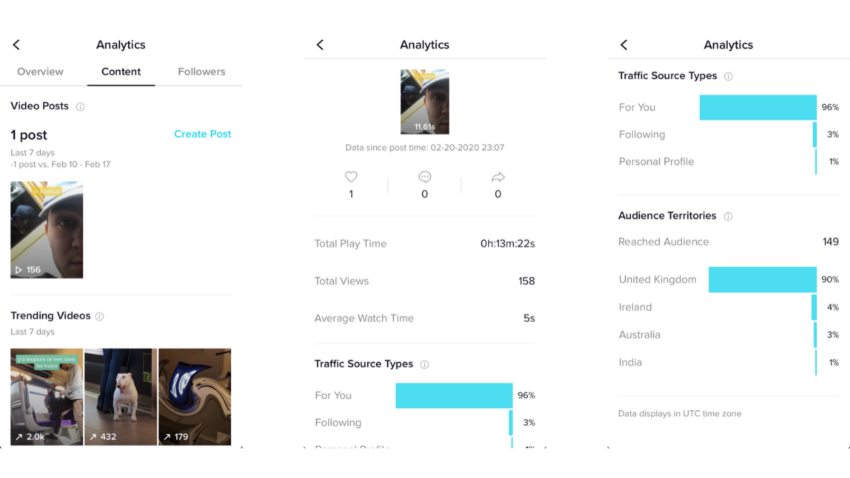
At the top of the Content tab, you first have the video posts section. Here you can see all the content you’ve posted over the past 7 days and their total view count.
If you tap on one of these videos, you then get access to a lot more detailed insights about that specific post. Such as the number of shares, average watch time, traffic source type, audience territories, and more.
Looking at the traffic source type, you can actually see the whereabouts of TikTok people who viewed your video. Here you can see that 96% of the views for this video came from the For You page, 3% from their own following feed, and then 1% viewed the video on my profile.
Trending Videos
Below the Video Posts section in the content tab, you can see your top 9 videos with the fastest growth in views over the past 7 days.
Again, if you want more insights into each video, you can tap on each one to see their in-depth analytics individually. If you’re looking for more video analytics for older videos, you can open up any video from your profile page, tap the three dots, and select Analytics for detailed video data about that post.
4. TikTok Followers Analytics
Here you get some useful data about your current followers, starting with the amount you have gained or lost over the past week.
Gender
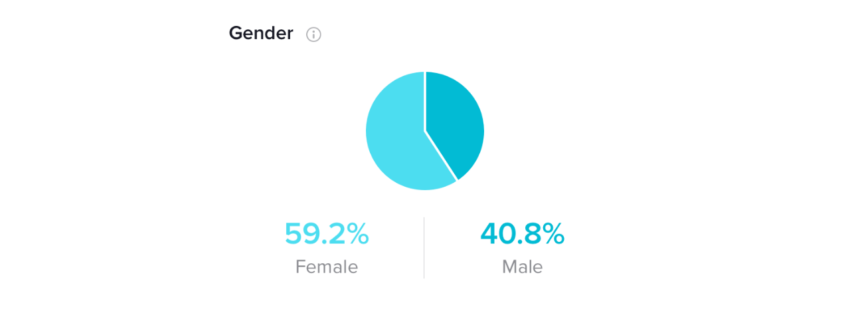
You can have access to the distribution of your followers by gender, thanks to this pie chart.
Top Territories
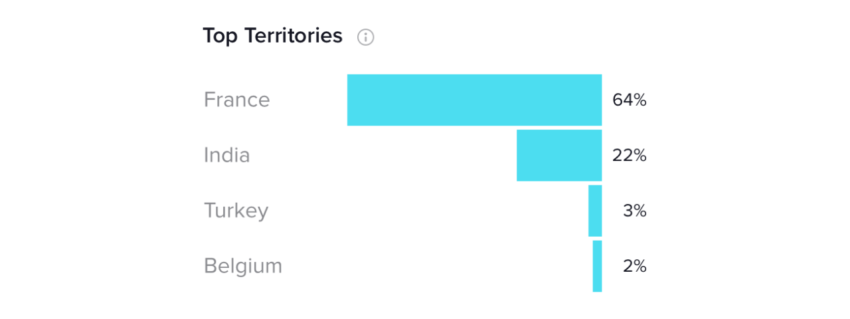
Then we have the top territories, this is the distribution of your followers by country. There are a maximum of 5 countries listed as long as each country makes up for at least 1% of your total follower count.
Follower Activity
Below the Top Territories is where it starts getting really interesting. Here you will find your Follower Activity. You have two options, to select by Hours or by Days.
Hours
Follower activity by hours gives you the times of day your followers are most active on TikTok. You can see here that roughly 1,100 people are active at 1 pm. This means that when we post in the future, we should aim for around 9 am to catch the wave of our follower’s activity throughout that day.
Days
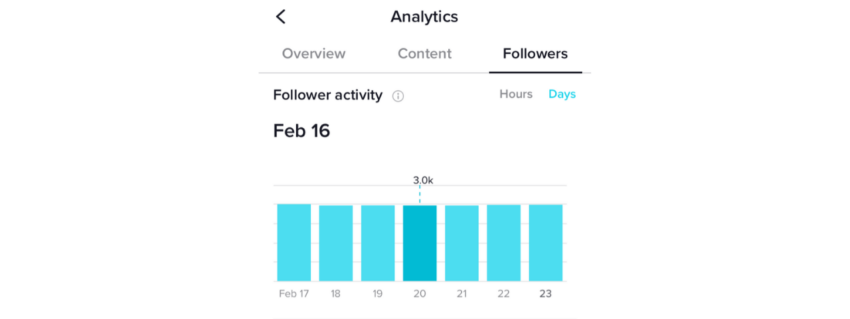
Follower activity by day shows you the times of the week when your followers are most active on TikTok. In our analytics, we think there might be a slight glitch due to the fact it says there are roughly 3,000 of my followers active every single day of the week.
So basically these Follower activity analytics should help you know what time to post on TikTok.
Videos Your Followers Watched
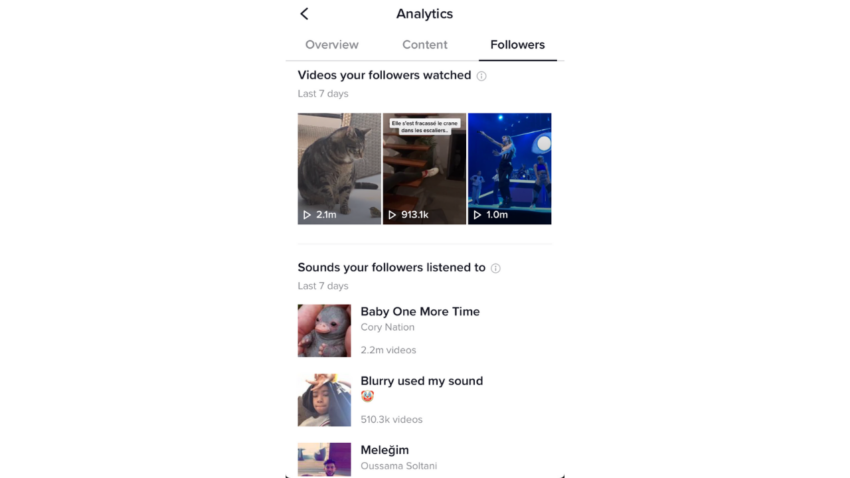
Right at the bottom of the Followers tab, there are two very interesting features. The videos your followers watched and the sounds your followers listened to. This can be extremely interesting to get an idea of what is popular with your current followers’ demographic.
It can also be a place to look for inspiration when it comes to creating new TikTok content for your page. Knowing that certain sounds are already popular with your audience is a great way to make content that will resonate well with them!
Conclusion
After reading all of this, you will be able to easily access your TikTok analytics and have a deeper understanding of how these analytics can give you feedback on the content you are creating. Always make sure to look at your TikTok insights so you know what kind of content to create next. Hope our article helps!


8 Responses
I appreciate the simplicity of the controls, which make it easy for beginners to play basketball random, while the strategic elements keep even experienced players hooked. A perfect balance!
TikTok analytics 101 is an essential tool for content creators looking to grow their presence on the popular social media platform.
Corporate Branding Services in Youngsville NC
My move happened unexpectedly, and there was very little time to organize it. I was in a panic until I came across a website offering moving companies in Norwalk services. The employees turned out to be real professionals! They not only arrived on time, but also helped me pack my things, disassemble and assemble the furniture. Everything went at the highest level! I will not try to move myself anymore – with such professionals it is easier and faster.
Recently, TikTok has developed quite strongly. This is also a big playground for content creators….Block Blast
@Geometry Vibes I like this post
Tiktok really took the community by storm and got people coming in to create content.
This is super helpful! I’ve been wondering how to actually see my TikTok analytics. It’s good to know you have to switch to a Pro Account first and then wait those 7 days for the data to show up. I thought I was doing something wrong when I didn’t see anything right away!
Great article on TikTok analytics! For anyone needing a break after analyzing data, check out some fun free online games to refresh your mind.